Historic Bitcoin Crossovers Flash Warning Signals AgainBitcoin (BTC) is trading near $89,200 at press time, posting a 1% rise over the past 24 hours. Still, one technical pattern is raising concerns. A crossover between two key weekly moving averages has taken place, something that has often marked the start of weaker price periods in the past.
Moving Average Crossover Returns
The 21-week exponential moving average (EMA) has crossed below the 50-week EMA, according to a chart shared by analyst Rekt Capital. This pattern has appeared during earlier market cycles. In both 2018 and 2022, Bitcoin followed a similar structure, and it plunged soon after.
The same crossover is now happening again in early 2026. Though BTC remains above $89,000, this setup has not been favorable in past cycles. It often marked a shift to slower growth or deeper corrections. Traders are now watching to see if history repeats or if the market behaves differently this time.
Meanwhile, on January 27, spot Bitcoin ETFs recorded more than $147 million in net outflows (per SoSoValues’s data). This shift may reflect reduced interest or profit-taking among larger holders. ETF outflows have often matched periods of selling pressure or lower trading momentum.
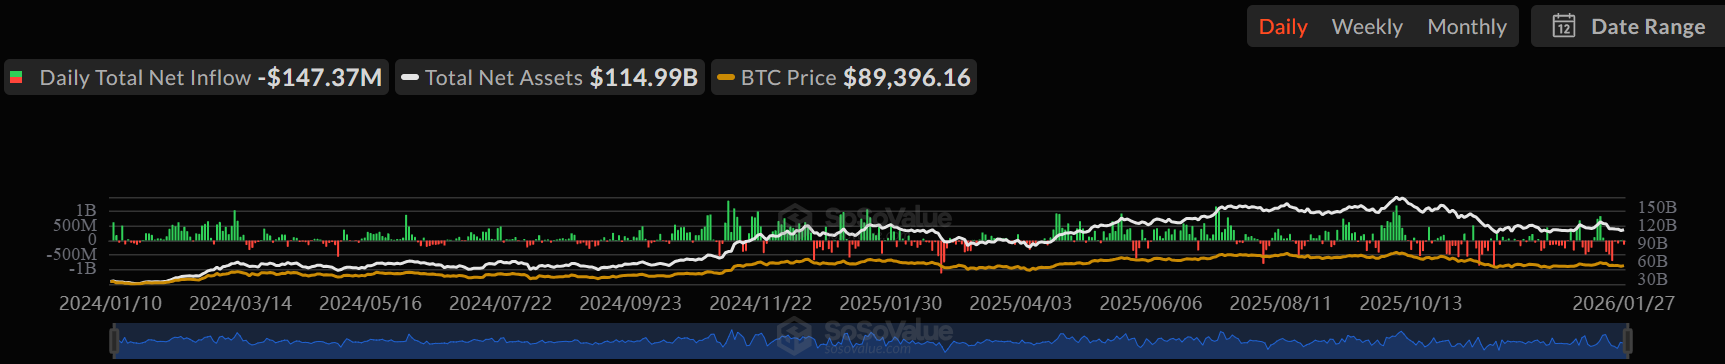 Bitcoin Spot ETF Net Inflow 1.28. Source: SoSoValue
Analysts are monitoring the $70,000–$75,000 range as a potential support zone if the current price fails to hold. Moreover, veteran trader Peter Brandt recently suggested that Bitcoin could fall toward $58,000 to $62,000 if the structure breaks lower.
Macro Events May Add Pressure
Two major events are set for January 28 that may influence crypto markets. US crude oil inventory data and the Federal Reserve’s interest rate decision are expected on the same day.
Historically, Bitcoin has shown weakness around Federal Open Market Committee (FOMC) meetings. Data from 2025 shows that after seven of the eight FOMC meetings, BTC experienced price drops. One of the largest was a 29% fall after the October 29 announcement. Chartist Ali Martinez wrote,
“HOW BITCOIN $BTC WILL REACT TO FOMC MEETING, LAST TIME IT DROPPED BY -9%.”
Supply in Loss Begins to Climb
According to analyst Woominkyu from CryptoQuant, Bitcoin’s Supply in Loss (%) is trending upward again. In past cycles, this was one of the early signs of a longer bearish trend.
The metric remains below levels seen during full capitulation, but the direction of change may be worth watching. Similar shifts were recorded in 2014, 2018, and 2022 before the market reached a low point.
The post Historic Bitcoin Crossovers Flash Warning Signals Again appeared first on CryptoPotato.
Source:
Historic Bitcoin Crossovers Flash Warning Signals Again

 Shoutbox
EU watchdogs warn of impersonation... by Administrator
 Total Members: 314