Bitcoin Price Analysis: Rally to $100K or Drop Below $90K Is Next for BTC?Bitcoin continues to consolidate just below a major resistance cluster after a strong recovery from the December lows. The price chart shows a clear sequence of higher lows, while on-chain data indicates that the percentage of supply in profit has undergone a deep reset and is now recovering.
Technically, the market is approaching an important decision zone: either a sustained breakout above the current ceiling opens the door to a new leg higher, or a rejection here triggers a corrective phase back toward recently established support levels.
Bitcoin Price Analysis: The Daily Chart
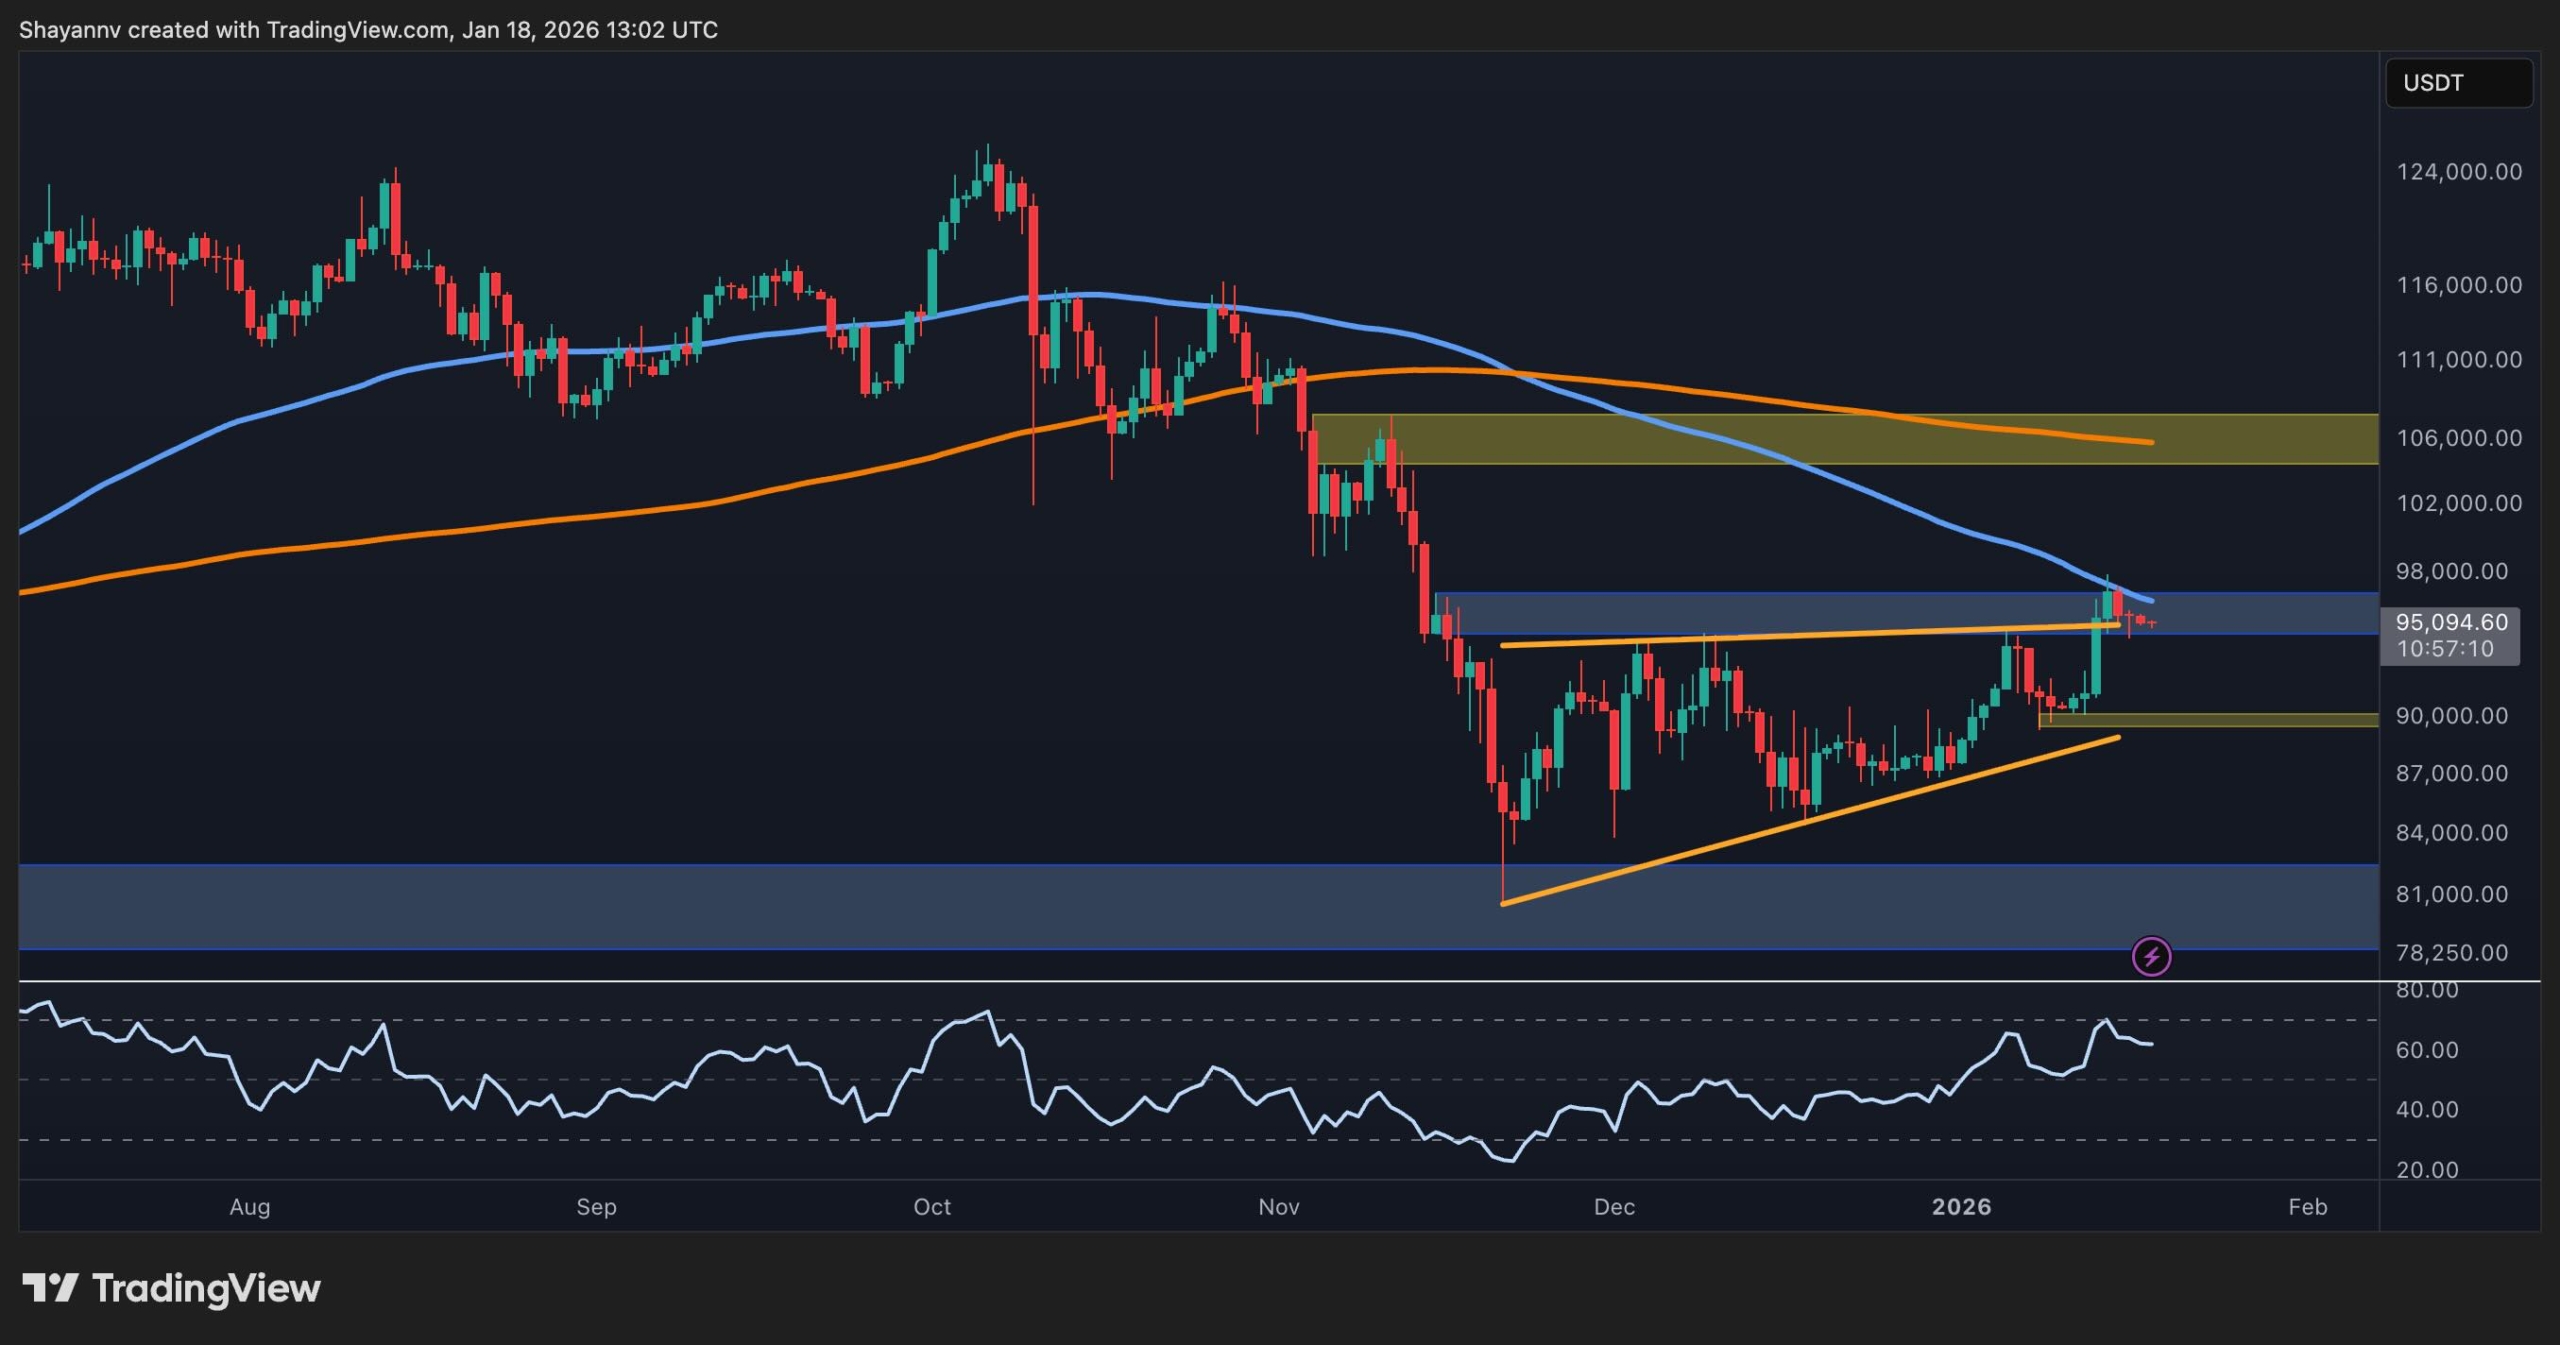
On the daily chart, BTC is trading around the $95,000 resistance band, which coincides with the lower boundary of a broader supply area and the 100-day moving average. This zone has acted as a price cap since November and is the key level currently under test.
Below the current levels, an ascending structure has formed from the $80,000 demand zone, creating a series of higher lows. The recent advance has pushed the asset from that base into the current resistance area without any meaningful daily pullback, leaving the $90,000 short-term level as the first notable support layer in case of a rejection.
Daily RSI has also cooled from recent overbought readings, but remains above the mid-line, consistent with a market in early or mid-trend rather than at a mature top. As long as the higher-low structure from the December bottom holds, the broader bias on the daily timeframe remains constructive, even if short-term volatility emerges around resistance.
BTC/USDT 4-Hour Chart
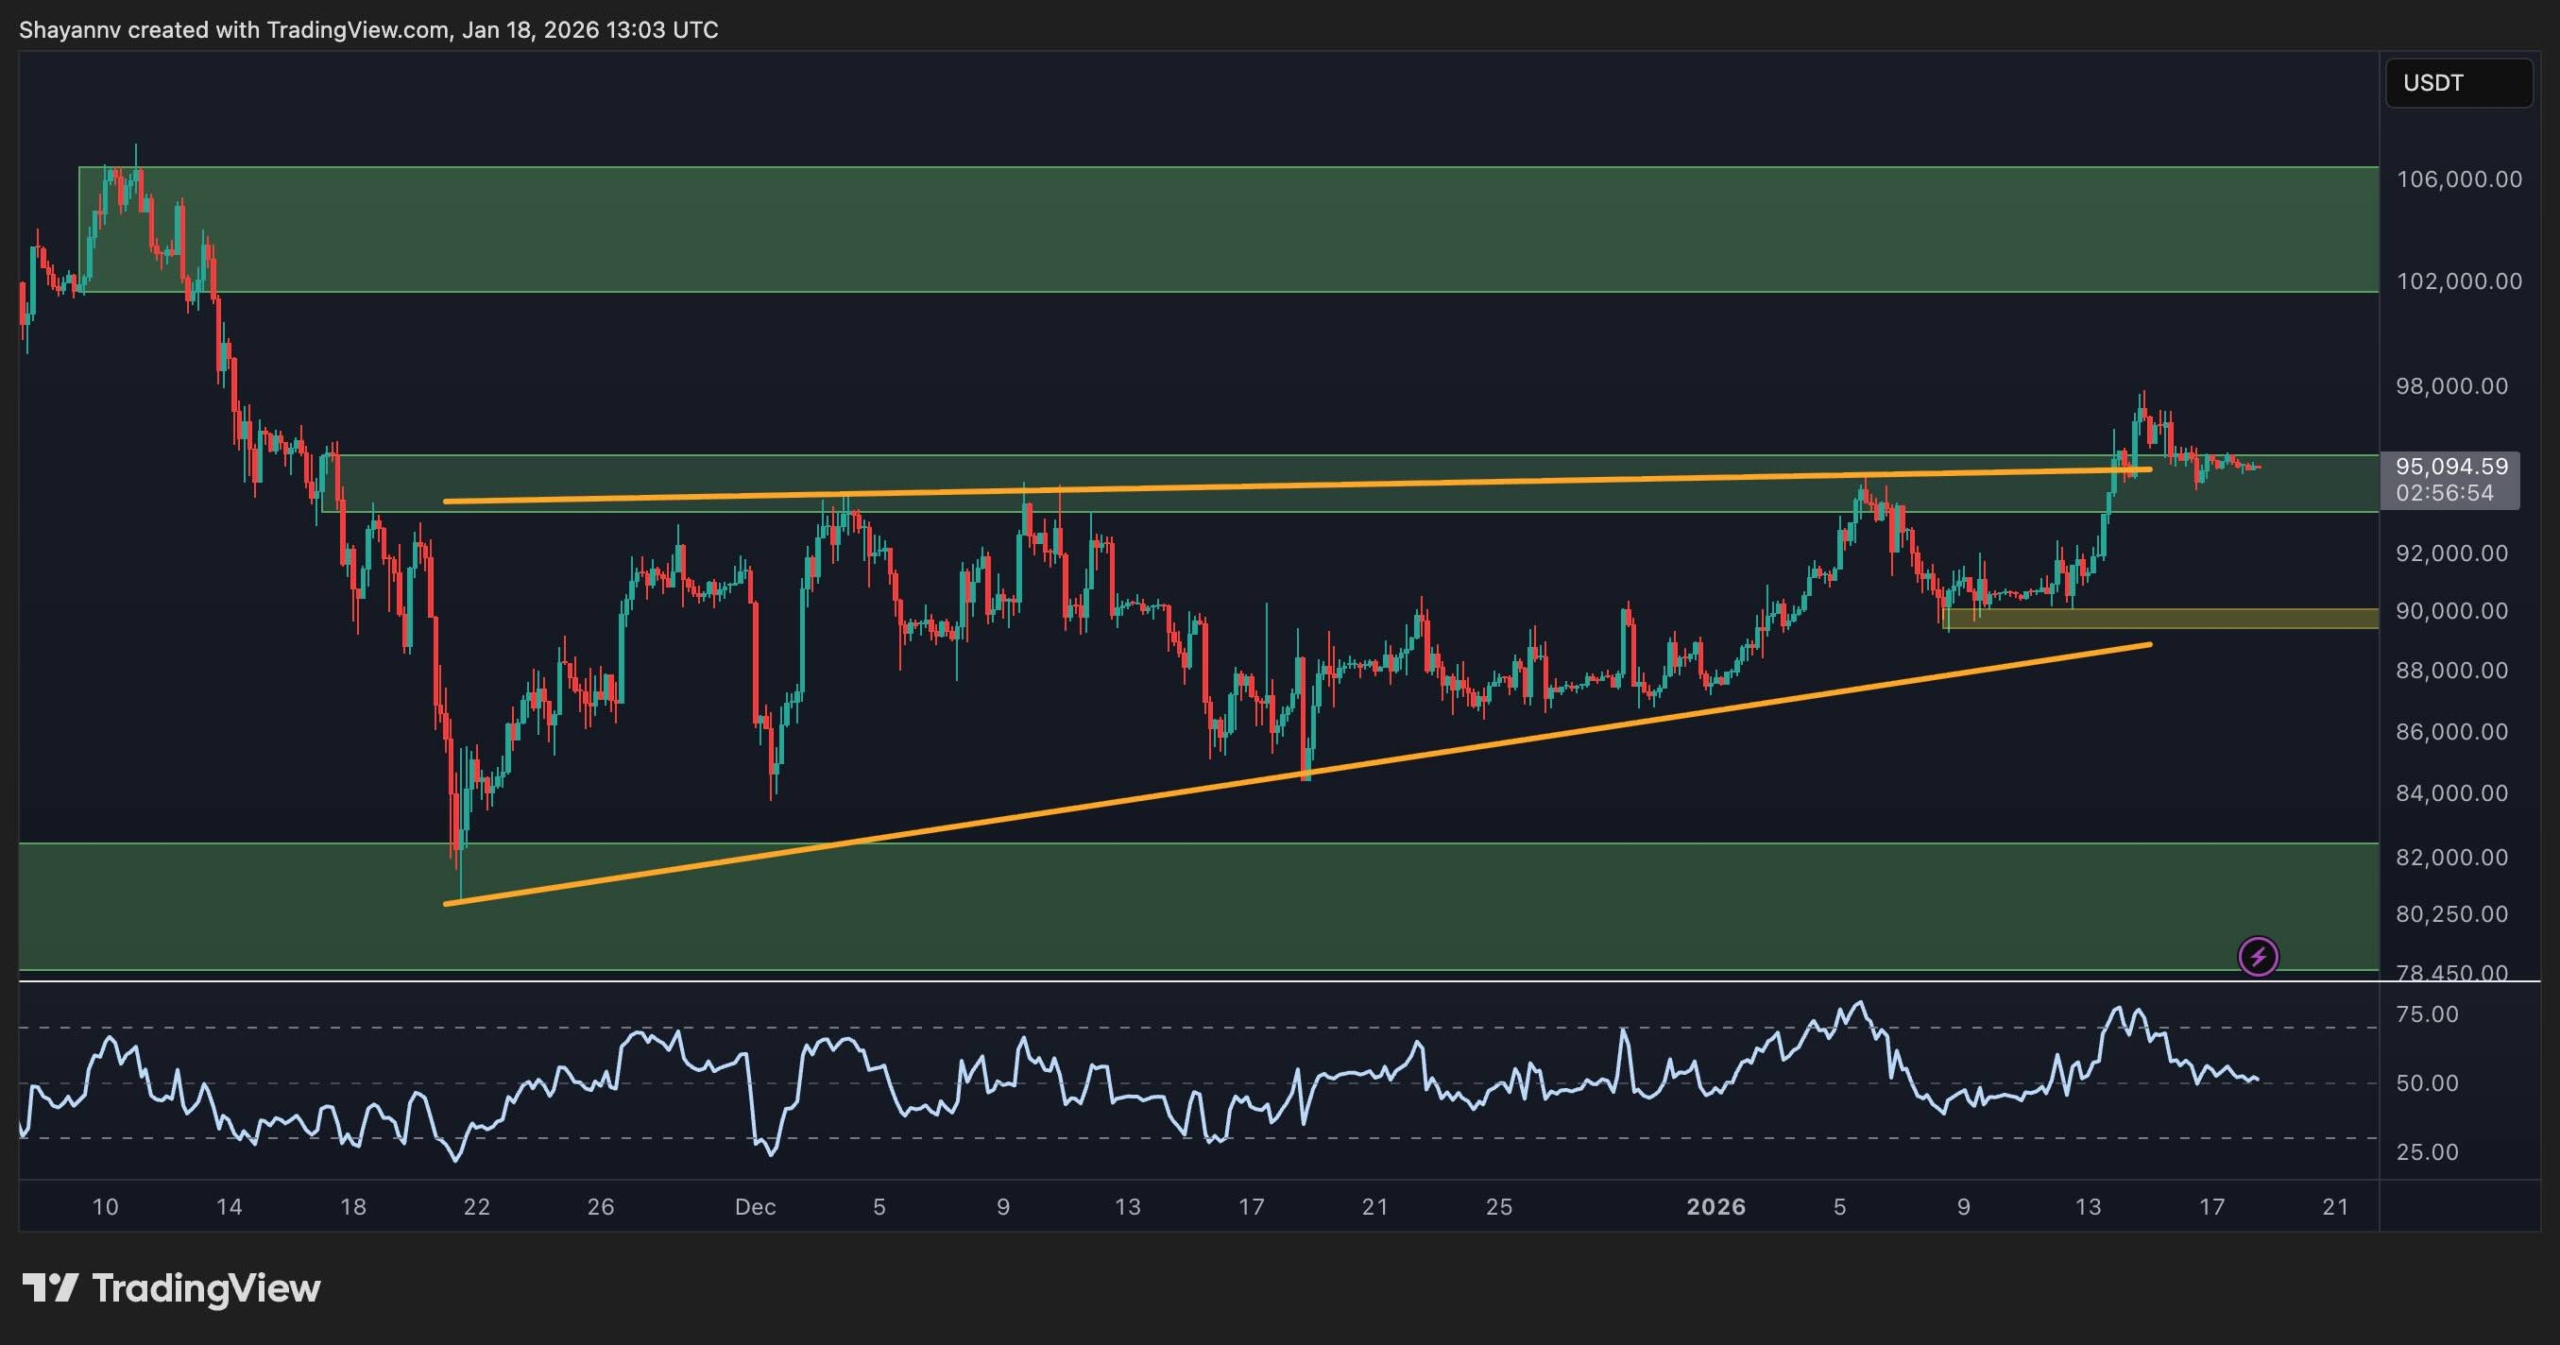
The 4-hour chart highlights the recent breakout from an ascending triangle structure. The price spent several weeks compressing between a flat resistance around the $95,000 mark and the rising trendline of the pattern. This resistance has now been marginally exceeded, and the market is consolidating just above the former range high, potentially targeting the $100,000 region next.
Yet momentum on the 4-hour RSI points to a downtrend, reflecting waning short-term strength and raising the risk of a corrective phase or at least a period of sideways consolidation.
If such a correction unfolds, $93,000–$94,000 forms the immediate breakout-retest zone, where stability would preserve the integrity of the bullish breakout. Further below, the $90,000 region marks the prior consolidation band and mid-range support, a logical area for a deeper but still healthy pullback within the prevailing uptrend.
On-Chain Analysis
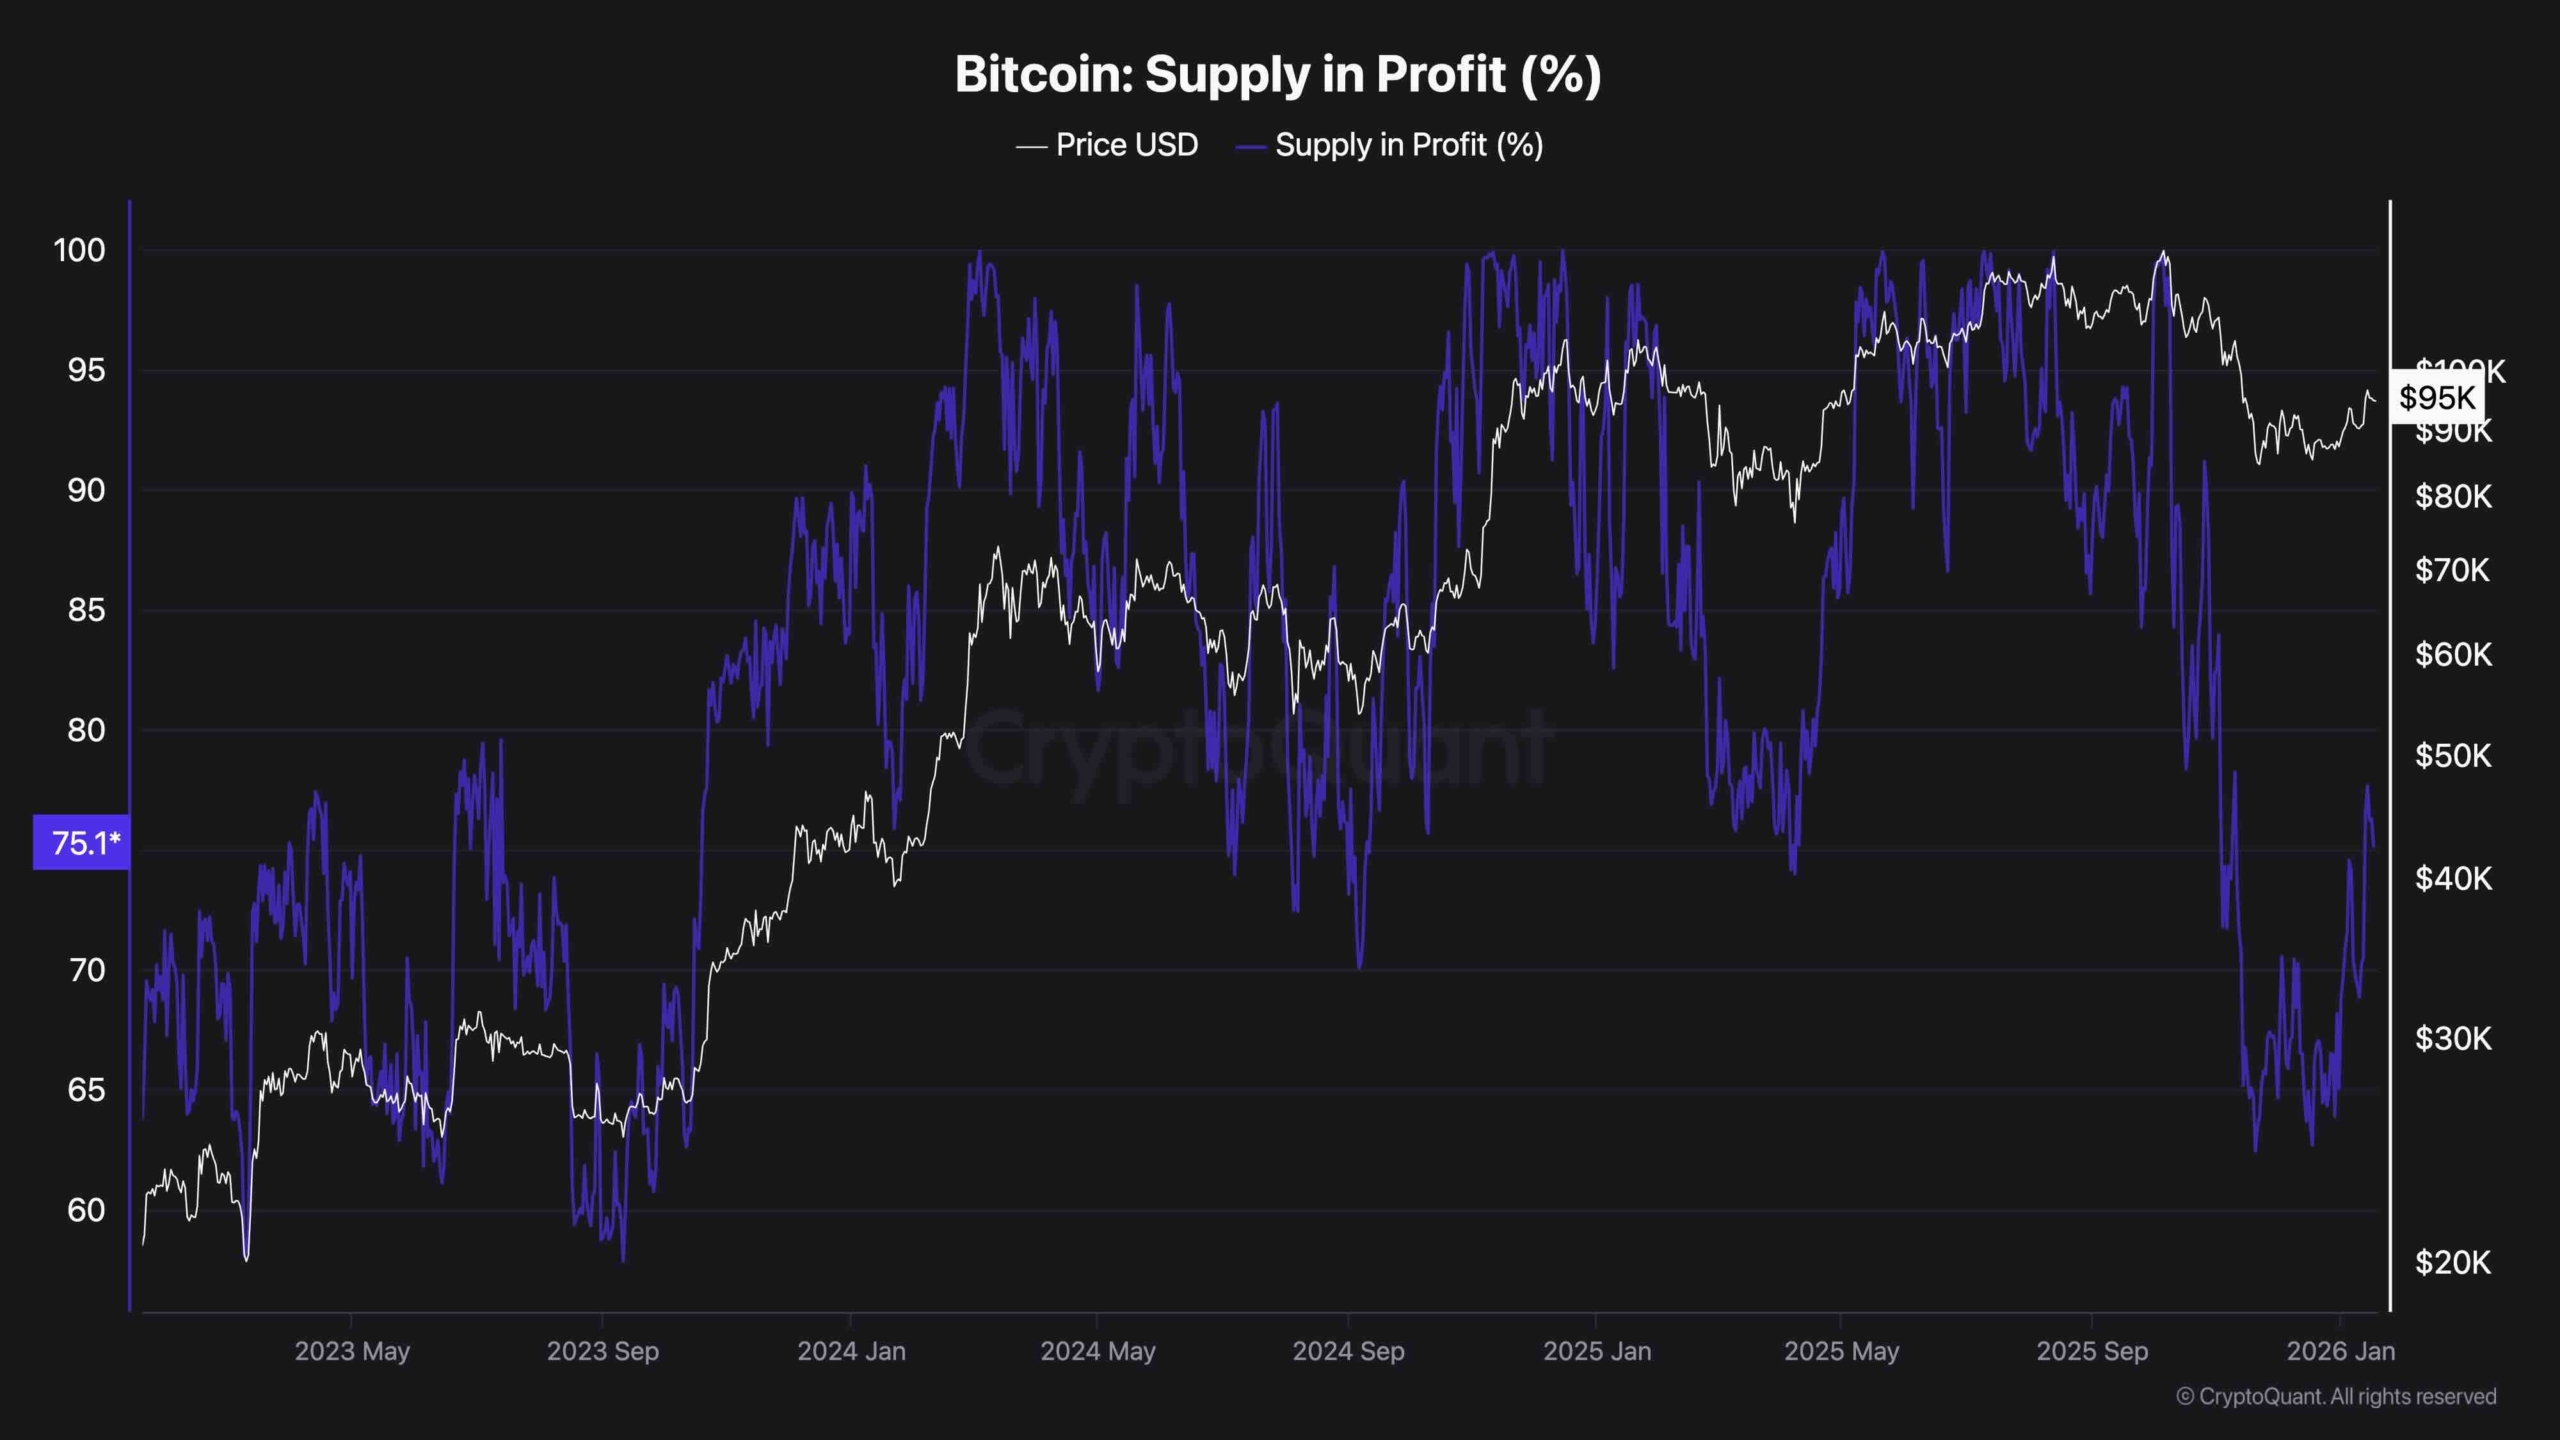
The Supply in Profit (%) metric currently provides an important cyclical signal. Recently, the percentage of circulating BTC that was in profit dropped to levels comparable to those seen when the spot price was below $30,000 earlier in the cycle. This occurred despite the current price being in the $90,000+ region.
Such a deep reset in profitability at a much higher nominal price indicates that a large portion of coins changed hands or saw unrealized gains compressed during the recent correction. Historically, similar resets have often preceded new medium-term advances, as weaker hands are flushed out and a more robust holder base emerges.
The metric is now recovering back toward the mid-70% range, suggesting that profitability is improving again but has not yet reached the extreme levels (above 95%) typically associated with late-stage euphoric phases. This combination can be interpreted as a constructive on-chain backdrop, consistent with the early stages of a potential new rally, provided that key technical resistance on the chart is eventually absorbed.
 s
s
The post Bitcoin Price Analysis: Rally to $100K or Drop Below $90K Is Next for BTC? appeared first on CryptoPotato.
Source:
Bitcoin Price Analysis: Rally to $100K or Drop Below $90K Is Next for BTC?

 Shoutbox
MANTRA Token Drops 18% to... by Administrator
 Music premium bitcoin, USDT...
by DallasraH
Music premium bitcoin, USDT...
by DallasraH  Total Members: 318