Bitcoin Price Analysis: $80K Battle Rages On as BTC’s Next Targets Come Into FocusBitcoin is trading around $79.7K after a sharp rebound from the $75K region stalled near $80K. The rejection keeps BTC within a short-term corrective structure, with the price now caught between a key demand zone below and overhead resistance that buyers have repeatedly failed to clear. Meanwhile, the Adjusted SOPR is sliding back toward its key 1 threshold, suggesting that profit realization across the network is fading.
Bitcoin Price Analysis: The Daily Chart
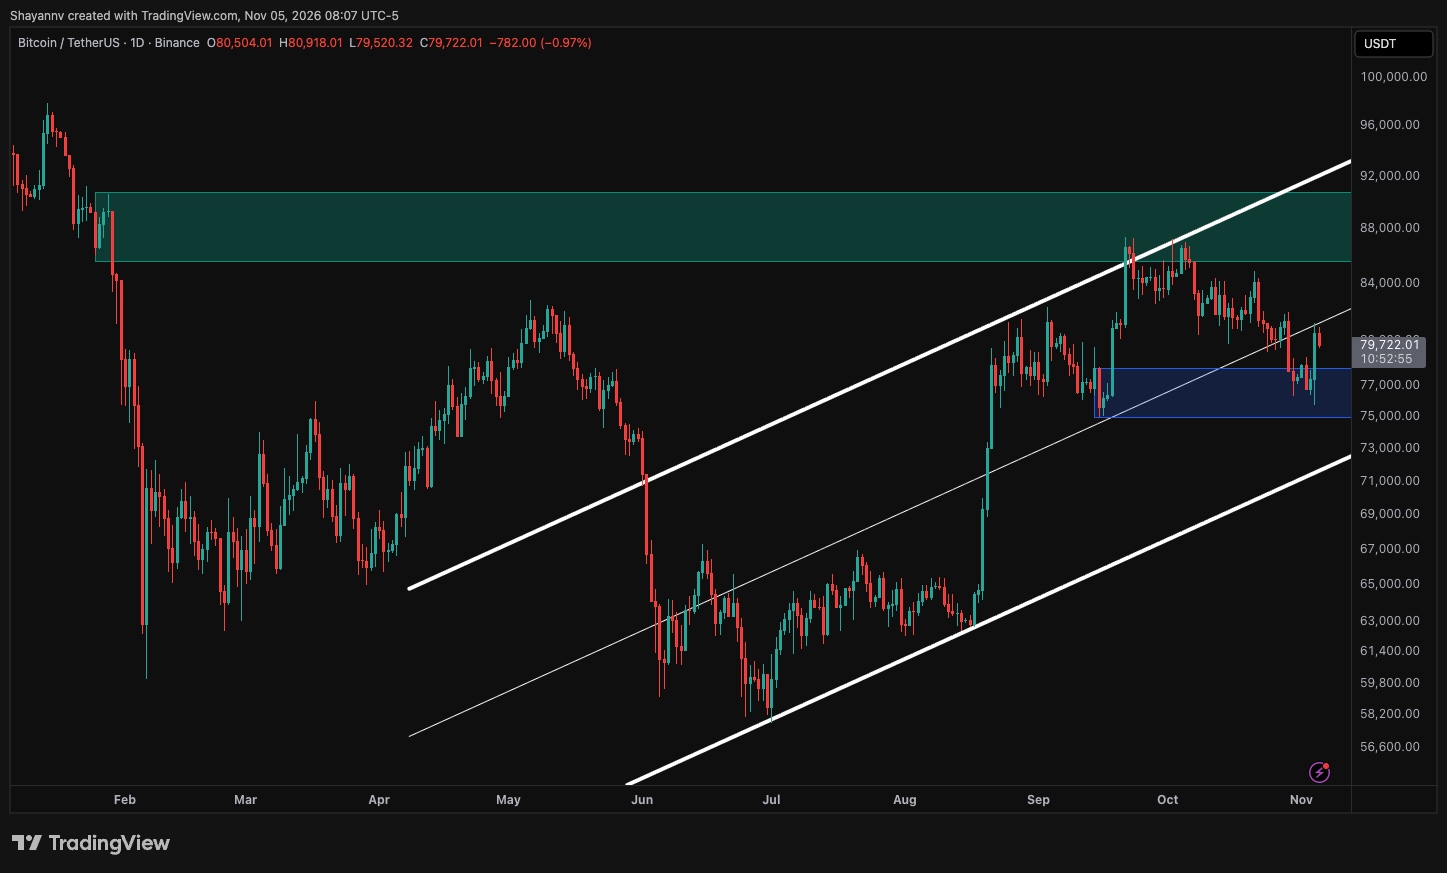
Bitcoin continues to trade within the ascending channel that has defined its recovery from the June lows near $58K. However, after two rejections from the channel’s upper boundary around $87K in September and early October, BTC began forming lower highs and slipped below the channel’s midpoint late last month.
The decline brought the price into the $75K-$78K demand zone, the order block that preceded the September rally toward $87K. Buyers responded with a long lower wick and a strong rebound, but the move stalled at the channel midline, which is now acting as resistance around $80K. Reclaiming it could pave the way for another advance toward the $87K supply zone, where the massive breakdown originated early this year.
Conversely, a decisive daily close below $75K would invalidate the order block and leave the channel’s lower boundary near $73K as the next support. A breakdown beneath this trendline would mark a clear failure of the broader recovery structure and raise the risk of a deeper move toward the low $60K region, where the price consolidated during the summer.
BTC/USDT 4-Hour Chart
The 4-hour chart shows that BTC has been trading within a descending channel since the late-September highs near $87K, printing consistent lower highs and lower lows. The upper boundary has capped every notable rebound, including the October spike into the $85K supply zone, which sellers quickly absorbed.
Yesterday, Bitcoin rallied aggressively from the $76K demand zone, which overlaps with the channel’s lower boundary. The move, however, was rejected at the confluence of the upper trendline and the $80K supply zone, which represents the bearish order block where the late-October breakdown began, and the price is now slipping back below it.
A sustained break above this confluence would mark the first breakout from the channel and could open the way toward $85K, followed by the $87K highs. Until then, rebounds remain vulnerable to overhead supply. A renewed drop below $76K would leave the descending lower boundary near $75K as the final short-term support before the daily channel floor around $73K.

On-Chain Analysis
The Adjusted Spent Output Profit Ratio (aSOPR) on CryptoQuant measures whether coins moved on-chain are, on average, being spent at a profit or a loss, excluding outputs younger than one hour to filter out short-term noise. Readings above 1 indicate profit realization, while values below 1 suggest holders are selling at a loss. The chart displays the metric’s 30-day exponential moving average.
The indicator remained above 1 throughout the 2024–2025 uptrend before dropping below it in early 2026, bottoming near 0.98 as BTC fell toward $60K. It reclaimed the threshold in August alongside the rally, peaking around 1.013 in October, but has since declined sharply toward approximately 1.003.
In healthy uptrends, the 1 level tends to act as support, as holders are reluctant to sell at a loss. A rebound from here would suggest demand is absorbing supply around the $78K zone, while a sustained drop below it would point to loss-driven selling. The metric alone does not confirm direction, but a move beneath 1 alongside a daily close below $75K would considerably strengthen the bearish case and potentially lead to another round of capitulation.

The post Bitcoin Price Analysis: $80K Battle Rages On as BTC’s Next Targets Come Into Focus appeared first on CryptoPotato.
Source:
Bitcoin Price Analysis: $80K Battle Rages On as BTC’s Next Targets Come Into Focus

 Shoutbox

TRM Labs Executive Calls Binance... by Administrator
 Total Members: 373